


Equity markets moved higher last in the week on a less than stellar jobs report that provided hope of no rate action by the Fed later this month. The AI buildout has been costly, with Goldman Sachs estimating more than $1 trillion, including private equity funding.1 According to Morgan Stanley, approximately $700 billion of the AI buildout has utilized private credit issued by private equity companies.2 Private credit often utilizes
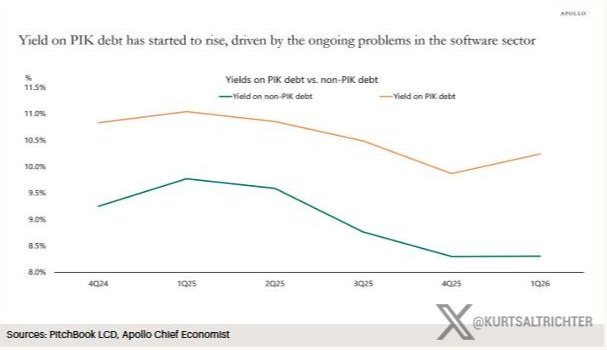
PIK (payment-in-kind) rates. Jeffrey Gundlach recently stated his concerns over PIK rates as defaults on private credit have moved higher to 6.3%.3 To use his simple example, a company lends $100 to a company for AI build out with a 10% interest owed annually. At the end of the year, if that interest (in this case, $10) isn't paid, it is simply tacked on to the principal, making the loan now $110.3 Stress is moving higher in that environment, as the graph above shows yields on PIK rates increasing. What happens if revenue expectations do not match fall short of revenue reality?
Markets are wonderful instruments to build real and lasting wealth. However, without a proper balance of risk, markets can remove some of that wealth, as well. We noted last week how concentrated the S&P 500 Index has become in technology stocks, largely due to AI.4 As the graphic
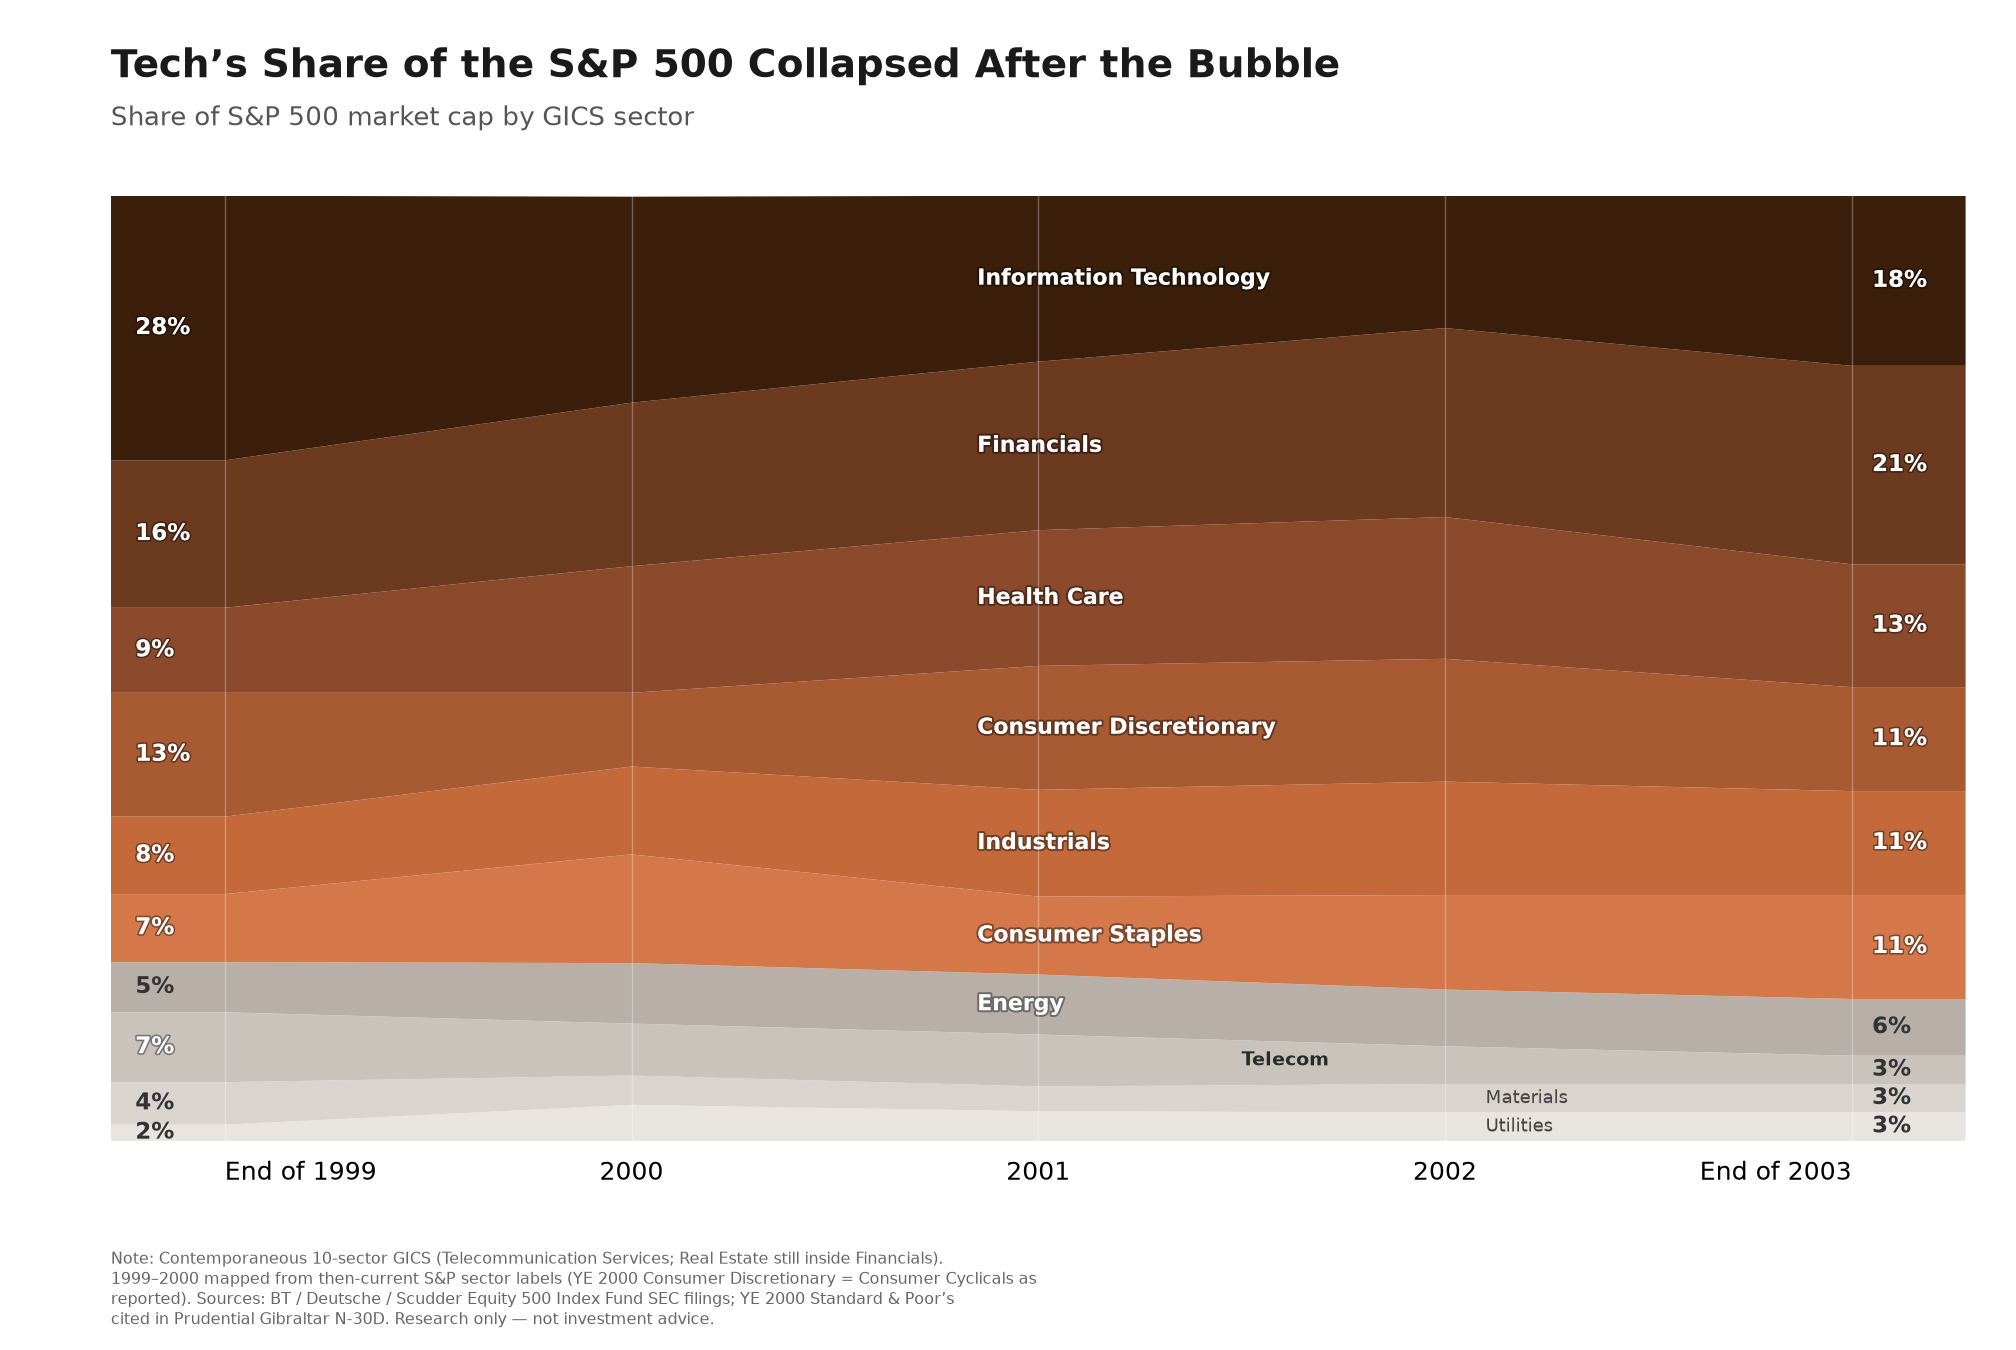
shows, the same occurred in 1999. Technology reached approximately 28% of the S&P 500 Index. As the Dot.com bubble burst, information technology came back down to a more reasonable level of approximately 18%. When a portfolio is exposed to stocks that are part of the concentration and those stocks are moving higher, concentration feels like a very good thing. However, when the flows change and those concentrated stocks come under pressure, concentration doesn't feel so appealing.
A poor jobs report last week showed that only 29,000 new jobs were created in September versus 89,000 expected.5 In addition, last month's number of 162,000 new jobs was revised lower to 133,000.5 This revelation sent probabilities higher that the next Fed decision later this month
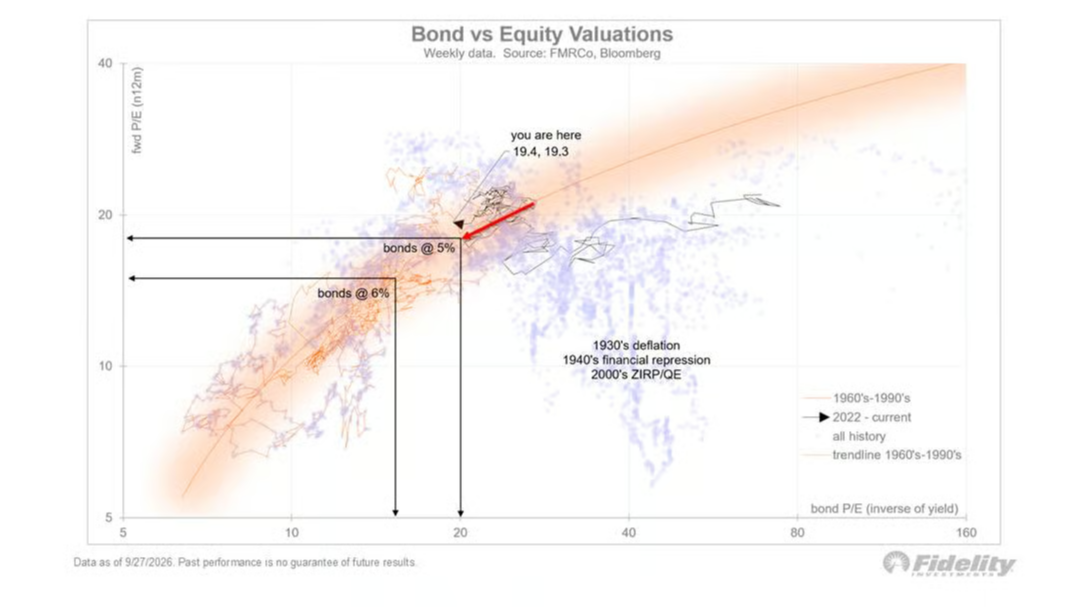
could be no rate change.6 The yield on the 10-year Treasury Bond has increased 86 basis points over 93 days.7 In addition to the rise in duration risk that accompanies a risk in interest rates, the Fidelity graphic above shows the price-to-earnings ratio on the S&P 500 Index at approximately 20x when rates are at 5%. However, if the yield on the 10-year Treasury were to rise to 6%, that has historically changed the P/E valuation of the S&P 500 Index from 20x to 16x. It's possible that could lead to an over-valued situation for equities, leading to downward pressure. There is still a case for equities to perform well if yields stay manageable, however, as we have been noting, investors would be wise to review their investments to ensure risk tolerance matches return expectations.
- https://www.goldmansachs.com/insights/articles/global-investment-is-forecast-to-exceed-1-trillion-in-2026
- https://alternativecreditinvestor.com/2026/07/08/the-ai-build-out-frenzy/
- https://youtu.be/g8EBfRk1rd0?si=dUyyk71dyJCc3qjp
- https://www.southernedgews.com/blog/living-the-crazy-life
- https://www.investing.com/economic-calendar/nonfarm-payrolls-227
- FedWatch - CME Group
- $UST10Y | SharpCharts | StockCharts.com
Disclosures
The information contained herein is for informational purposes only and is developed from sources believed to be providing accurate information. The opinions expressed are those of the author, are for general information, and should not be considered a solicitation for the purchase or sale of any security. The decision to review or consider the purchase or sell of any security should not be undertaken without consideration of your personal financial information, investment objectives and risk tolerance with your financial professional.
Forecasts or forward-looking statements are based on assumptions, may not materialize, and are subject to revision without notice.
Any market indexes discussed are unmanaged, and generally, considered representative of their respective markets. Index performance is not indicative of the past performance of a particular investment. Indexes do not incur management fees, costs, and expenses. Individuals cannot directly invest in unmanaged indexes. The S&P 500 Composite Index is an unmanaged group of securities that are considered to be representative of the stock market in general.
Past Performance does not guarantee future results.