


Retail investors added to out-of-favor momentum stocks last week, helping tech shares to recover some recent losses. Last week it was revealed that Nvidia CEO Jensen Huang was found to have had affairs within and outside the company and has since stepped down as CEO.1 This event raises questions about the company's long-term growth prospects and whether this will bleed over
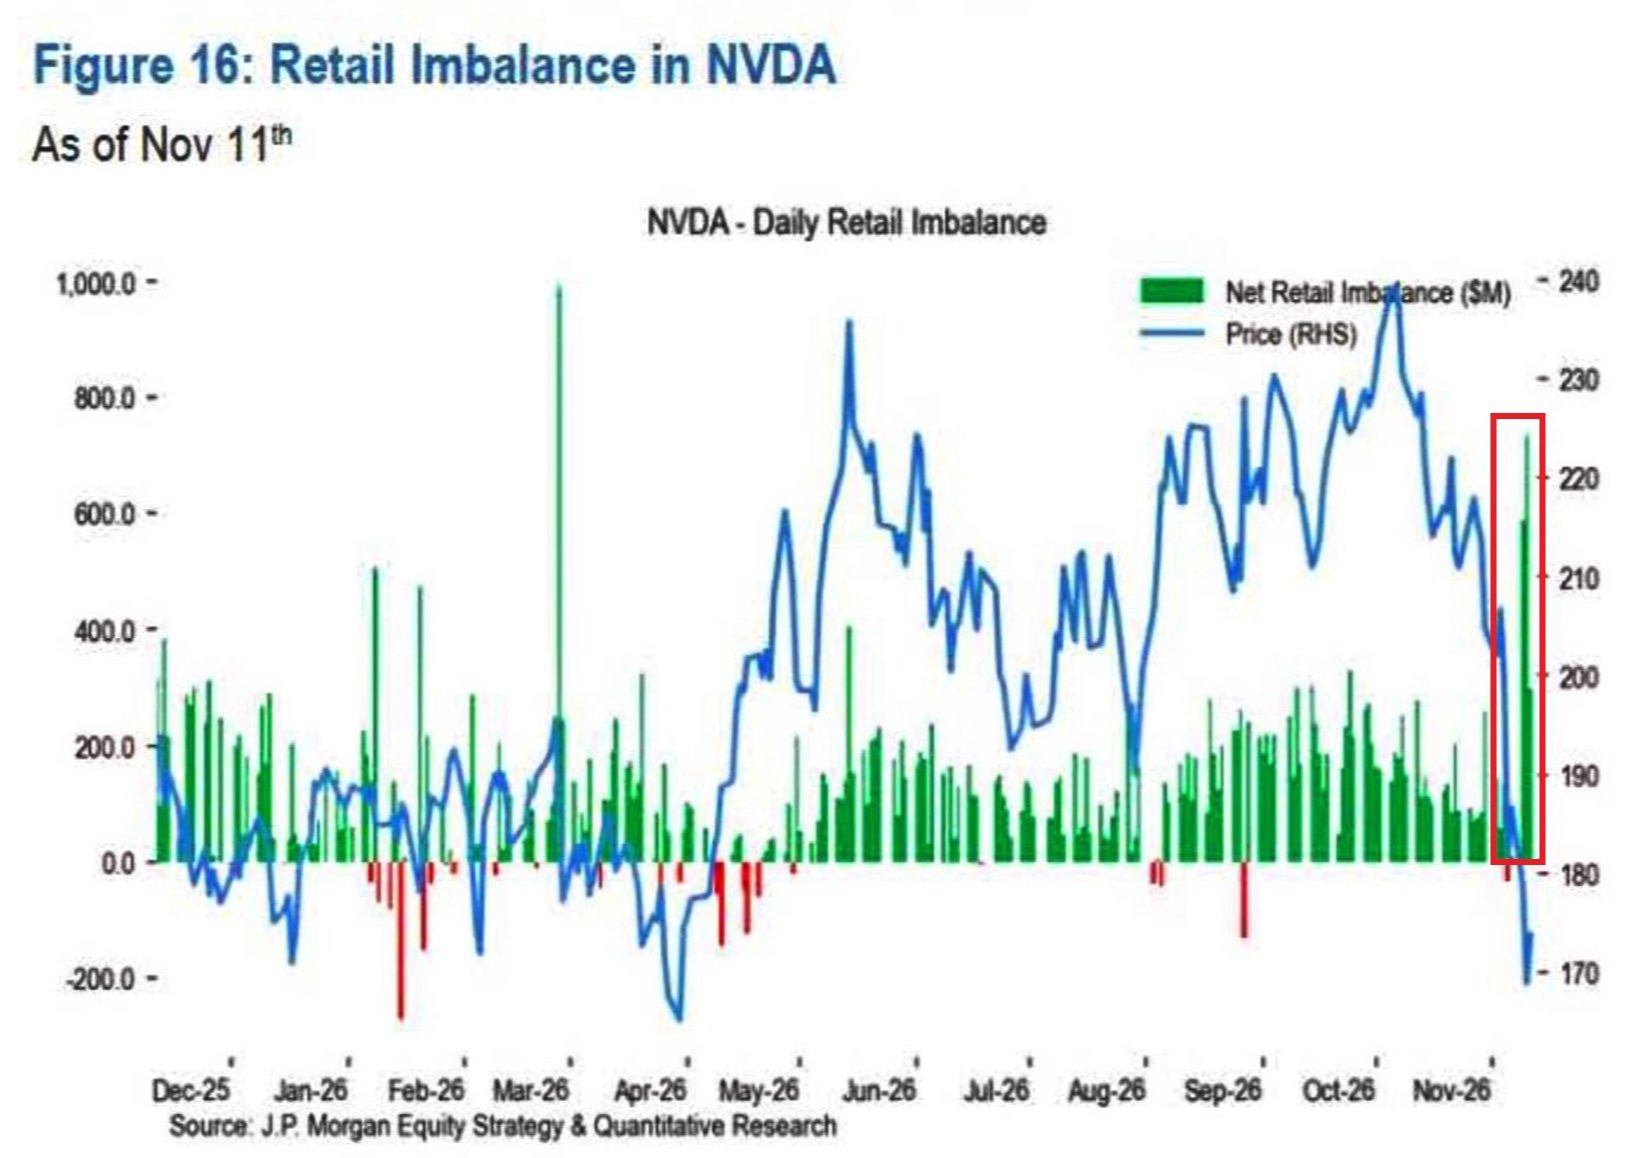
into the growth of other AI-related companies.1 In June of this year, as we noted last week,2 bond prices of some of the more notable AI-related companies were falling as those same companies' stocks were rising. However, that does not seem to have frightened retail investors away. Last week, the 2x leveraged Nvidia ETF attracted +$64 million, on track for its largest weekly inflow since February 2026.3 During Thursday's session, retail investors bought +$455 million of the company's stock and sold -$345 million, bringing net purchases to +$111 million.3
On the economic front, it is looking more and more like the Fed is digging its heels in on fighting inflation and raising interest rates. The days of "free money" or loose financial constraints by the Fed may be a thing of the past for the foreseeable future. This week, the Consumer Price Index was higher than expected at +0.4% for October versus +0.3% expected.4 There was no October
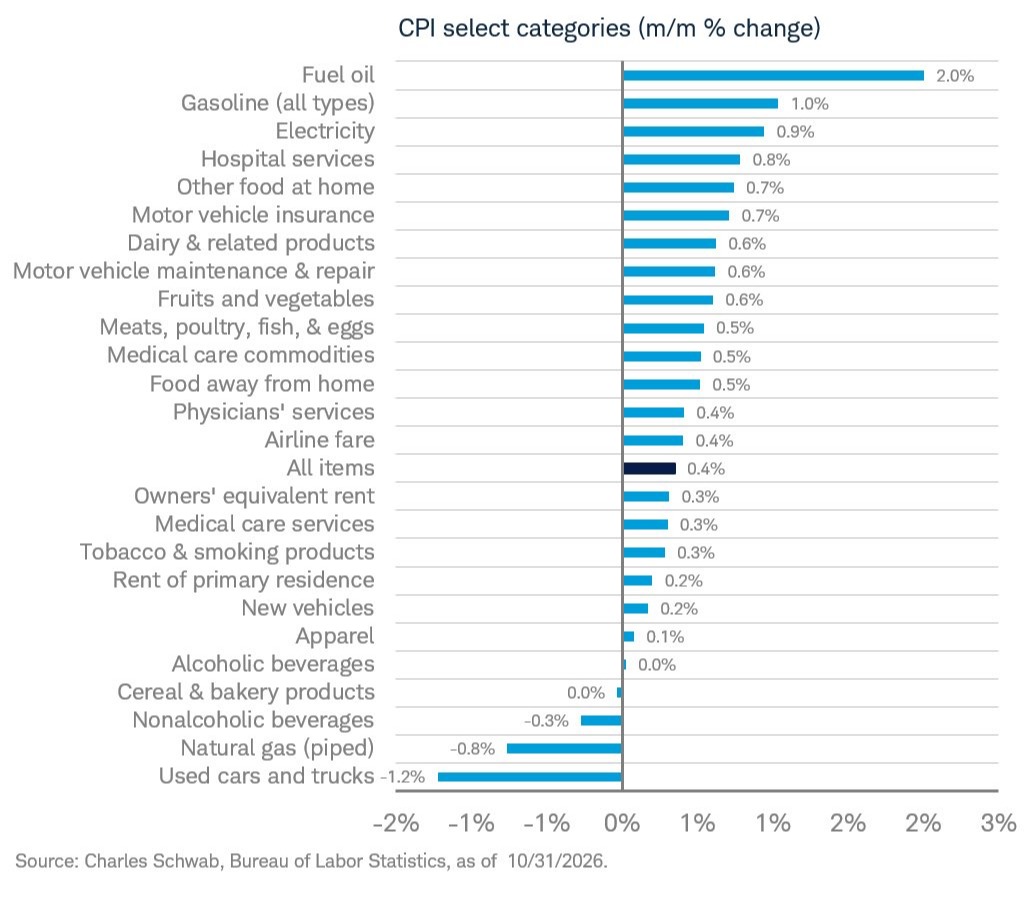
On the economic front, it is looking more and more like the Fed is digging its heels in on fighting inflation and raising interest rates. The days of "free money" or loose financial constraints by the Fed may be a thing of the past for the foreseeable future. This week, the Consumer Price Index was higher than expected at +0.4% for October versus +0.3% expected.4 There was no October 2025 report, so the year-over-year number for last month was not reported. Oil, the usual culprit lately, was the primary contributor to higher inflation. This drove the Fed Funds futures higher, as of November 12, 2026, to at least an 92% probability of a 25 basis point rate hike next month.5 In fact, there is now an 8% probability of a 50 basis point rate hike in December. Fed Governor Waller indicated that he would be willing to support a 50 basis point hike6 should Core CPI come in at +0.3% or higher - which, in fact, it did.7
The U.S. consumer has certainly been resilient over the past three years. Redbook Sales on a year-over-year basis have averaged over 8% this year, which is nearly double the long-term historical average of 4.4%.8 But, is the U.S. consumer taking on too much debt. Credit Card debt has reached over $1.2 trillion in the U.S., as shown in the graphic. At the same time, the average interest
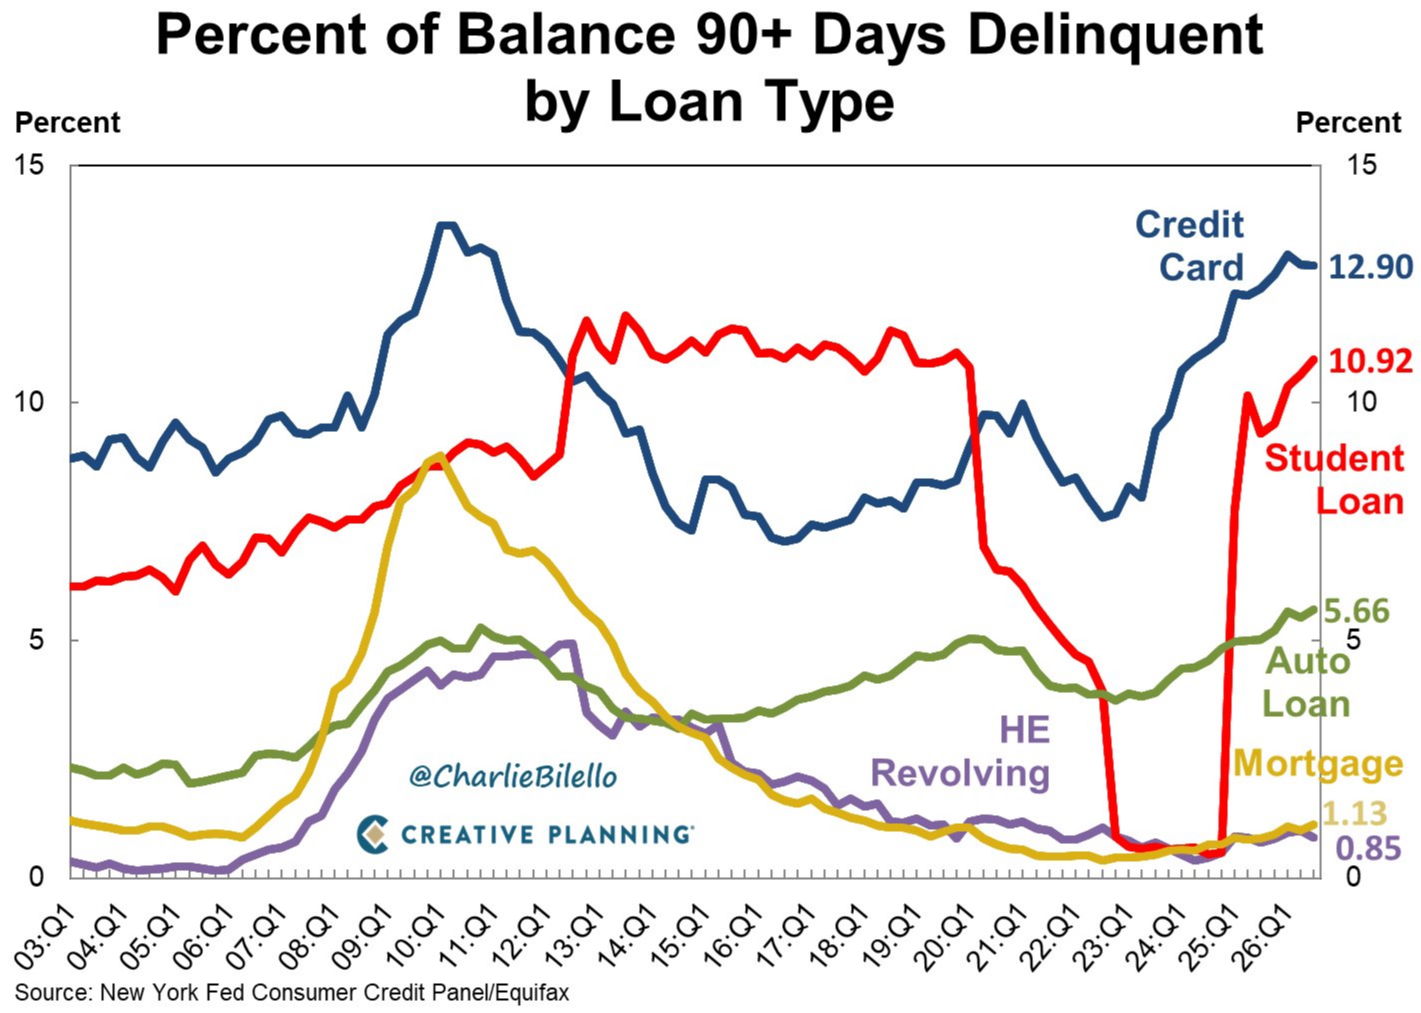
rate on credit cards is just over 22%.9 While household debt service payments as a percent of disposable personal income remain relatively low, the amount of balances that are becoming delinquent are on the rise.10 Credit card debt that is 90+ days in delinquency is just over 12%, as displayed in the graphic. That is on par with the delinquency rate near the end of the 2008 financial crisis. Adopting a solid diversification approach to investing could help mitigate risks, notably when market themes shift.
- https://www.investing.com/news/technology-news/nvidia-ceo-huang-steps-down-5021971
- https://www.southernedgews.com/blog/money-for-nothing
- https://x.com/kobeissiletter/status/2121171229210005816?s=12
- https://www.investing.com/economic-calendar/cpi-69
- FedWatch - CME Group
- https://www.federalreserve.gov/newsevents/speech/waller20261110a.htm
- https://www.investing.com/economic-calendar/core-cpi-56
- https://www.investing.com/economic-calendar/redbook-911
- Commercial Bank Interest Rate on Credit Card Plans, Accounts Assessed Interest (TERMCBCCINTNS) | FRED | St. Louis Fed
- Household Debt Service Payments as a Percent of Disposable Personal Income (TDSP) | FRED | St. Louis Fed
Disclosures
The information contained herein is for informational purposes only and is developed from sources believed to be providing accurate information. The opinions expressed are those of the author, are for general information, and should not be considered a solicitation for the purchase or sale of any security. The decision to review or consider the purchase or sell of any security should not be undertaken without consideration of your personal financial information, investment objectives and risk tolerance with your financial professional.
References to specific securities are for illustrative purposes only and are not recommendations.
Forecasts or forward-looking statements are based on assumptions, may not materialize, and are subject to revision without notice.
Any market indexes discussed are unmanaged, and generally, considered representative of their respective markets. Index performance is not indicative of the past performance of a particular investment. Indexes do not incur management fees, costs, and expenses. Individuals cannot directly invest in unmanaged indexes. The S&P 500 Composite Index is an unmanaged group of securities that are considered to be representative of the stock market in general.
Past Performance does not guarantee future results.